
Reports and dashboards
See which clients, projects and people make you money
Start from a template for revenue, billed versus collected, time by project or pipeline, and get subtotals, a grand total, headline numbers and a chart. Every report runs with your permissions.
Included on every plan, including Free.
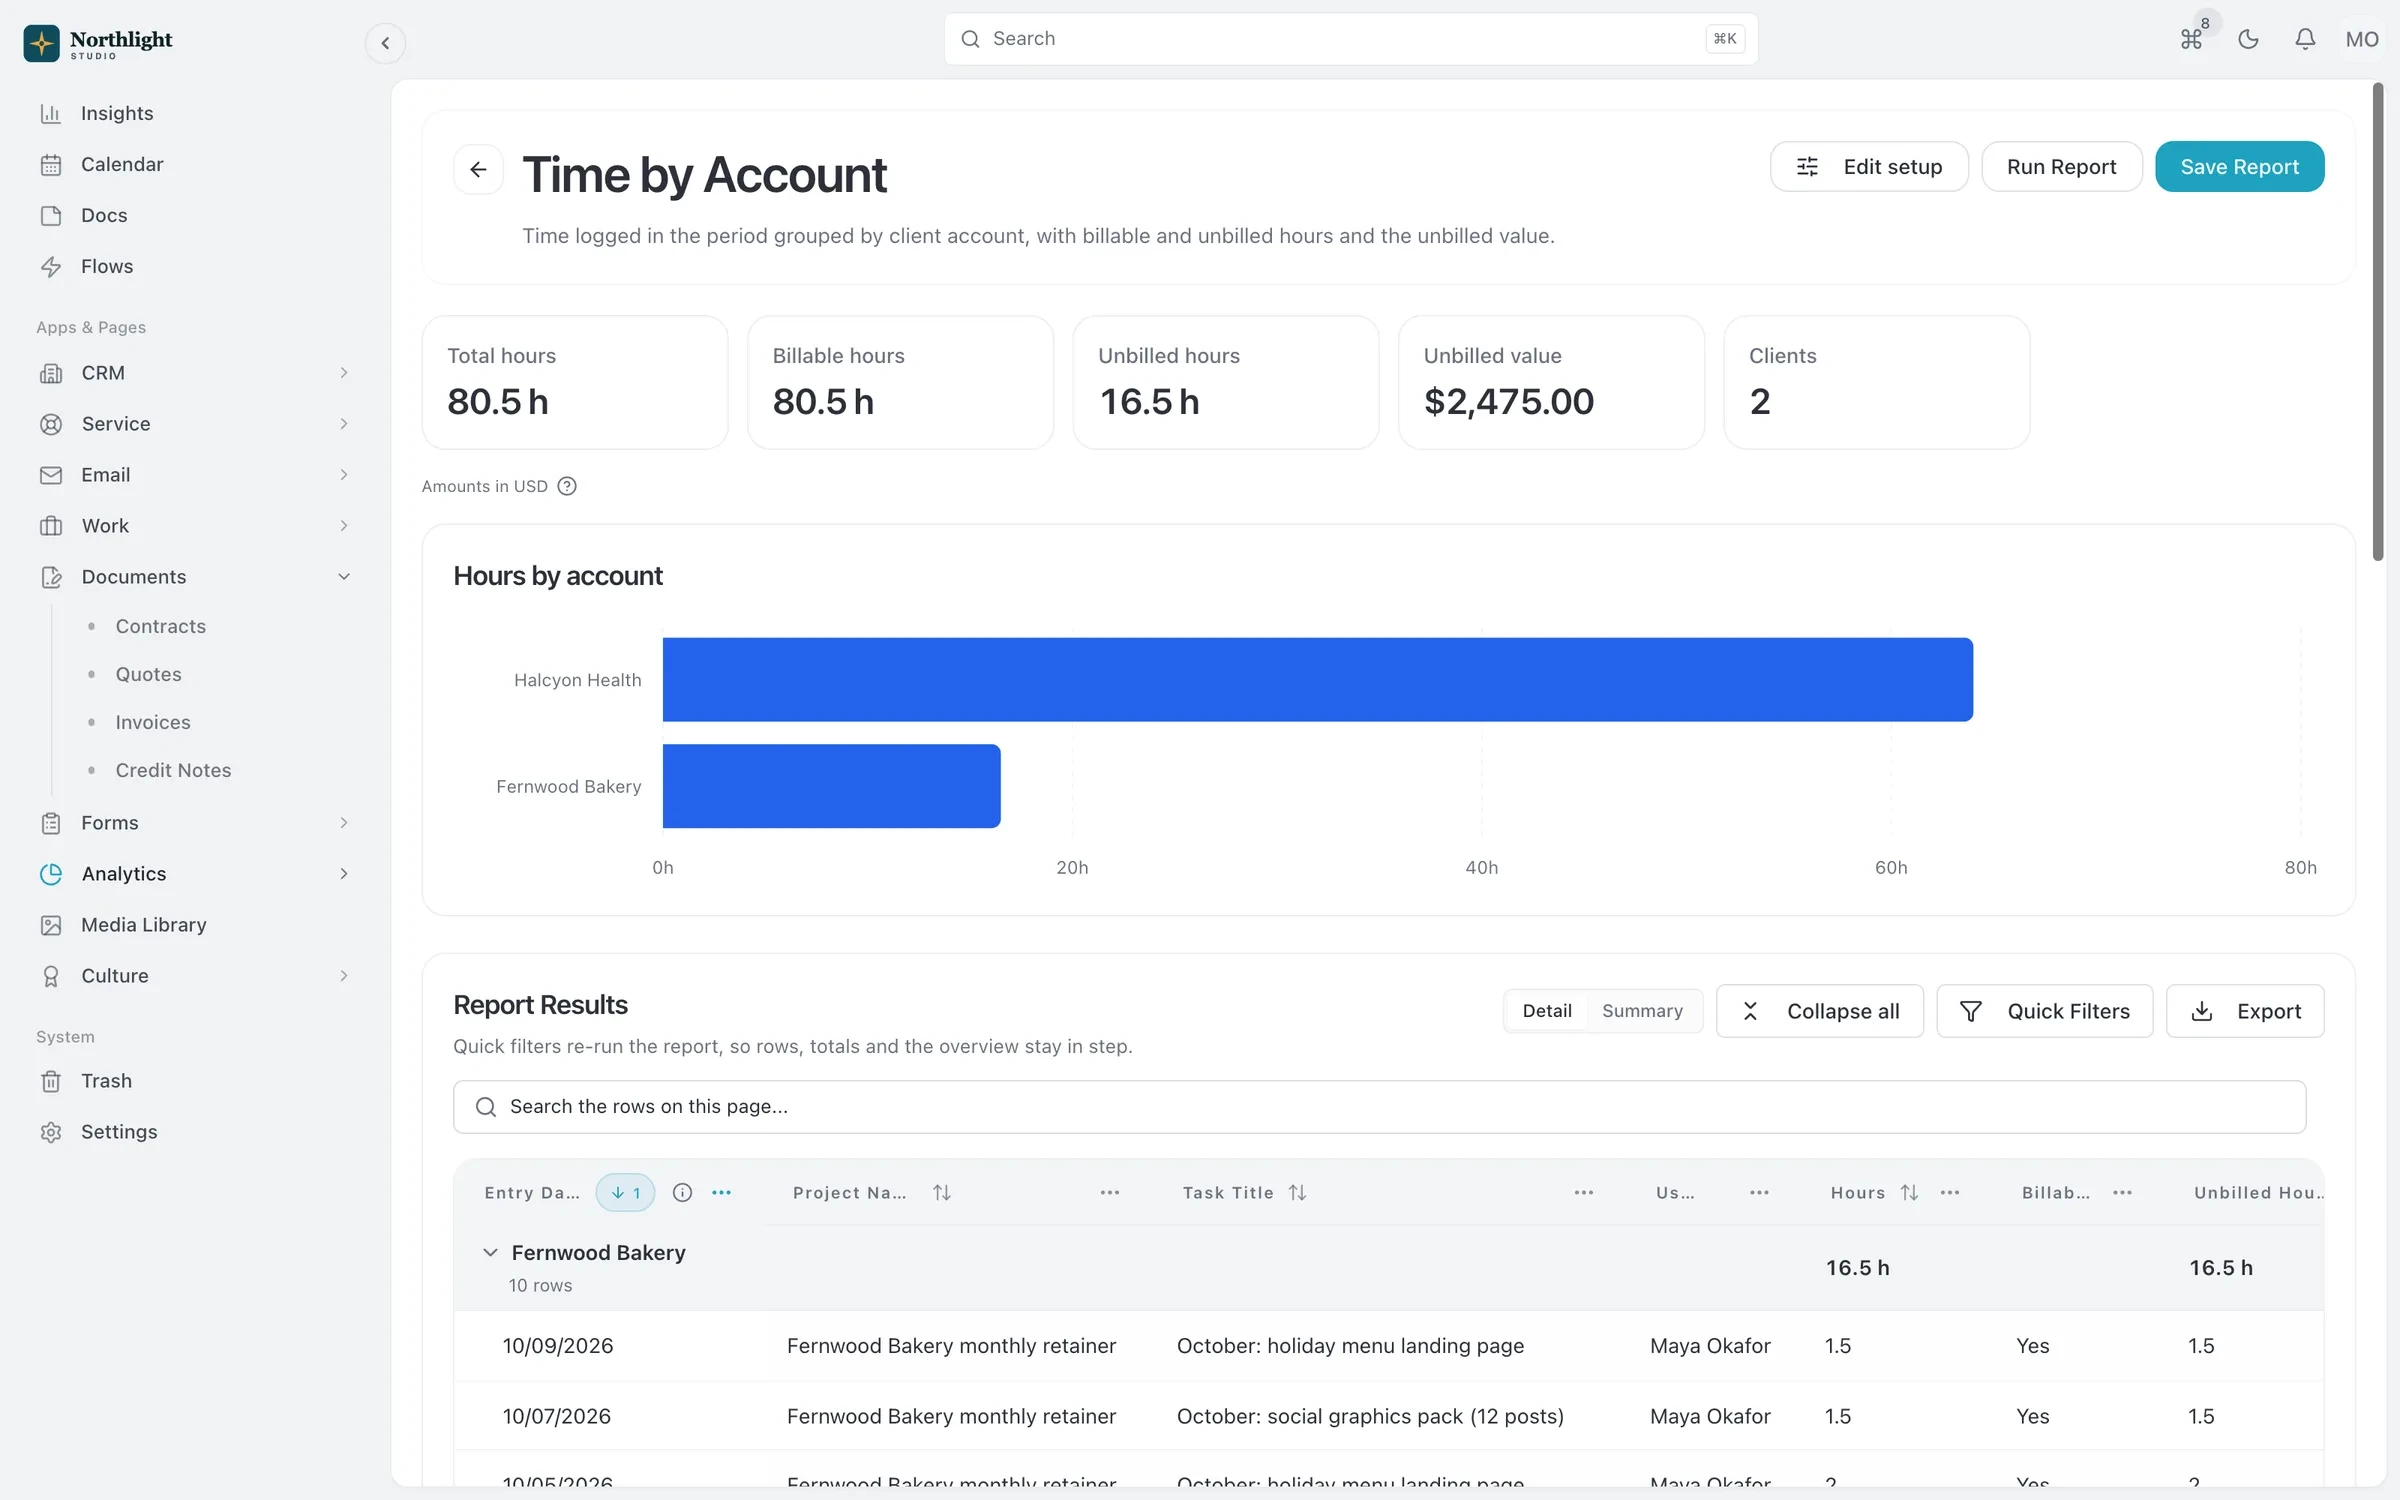
- Group subtotals
- Grand total
- Headline numbers
The problem
Sound familiar?
- Month-end numbers take a day of spreadsheet work.
- I can't see billed versus collected without exporting every invoice.
- I don't know which clients are profitable until the year is over.
How it works
From question to answer
1
Pick a template
Each template comes with headline numbers, a chart, grouping with subtotals and quick filters already set up.
2
Filter and group
Quick filters update the table, headline numbers and chart together. Group by client, project or owner to get subtotals.
3
Adjust the setup
Change columns, filters, grouping and the chart in a side panel while the results stay visible, and freeze key columns.
4
Save and share
Save the report, export the results, and build dashboards with stat cards, charts and tables.
What you get
- Subtotals and grand totals
- Detail rows by default, with group headers, subtotals and a grand total. Switch to summary for one row per group.
- Numbers across every row
- Headline numbers and charts are calculated over all matching rows, not just the page on screen.
- Finance figures you can trust
- Invoiced amounts are net of credit notes, credits are shown separately, and collection rate is collected over net invoiced.
- Related fields
- Bring linked names, owners, dates and amounts into one report, such as time grouped by project or invoices by due date.
- Dashboards
- Stat cards, line, bar and pie charts, tables and activity feeds, on shared or personal dashboards.
- API and MCP activity
- A built-in report lists every API and AI assistant request with the tool, person, record and result.
Read the documentation
Works with
Projects and time tracking
Projects, task boards, timers and timesheets, with budgets and hours that carry into invoices.
Learn moreQuotes and invoicing
Quotes that become deposit, progress and final invoices, plus invoicing from hours and credit notes.
Learn moreExpenses
Receipts, mileage, per diem, budgets and approvals, linked to the projects the spending belongs to.
Learn more
Used by: consultancies
Reports and dashboards: questions
Something else? Ask us.
Do reports respect who can see what?
Yes. Reports run with your permissions, so they only include records you are allowed to see.
Can I export report results?
Yes. Save any report and export its results.
Can my AI assistant run a report?
Yes. Through the MCP server, Claude or ChatGPT can list your saved reports and run one live.
How many dashboards can I create?
Free includes 2 dashboards, Solo 5, Team 25 and Business 100.
Run your next client project in SparkDesk.
Start a 14-day free trial of any paid plan. No card needed, and you can drop to the Free plan at any time.